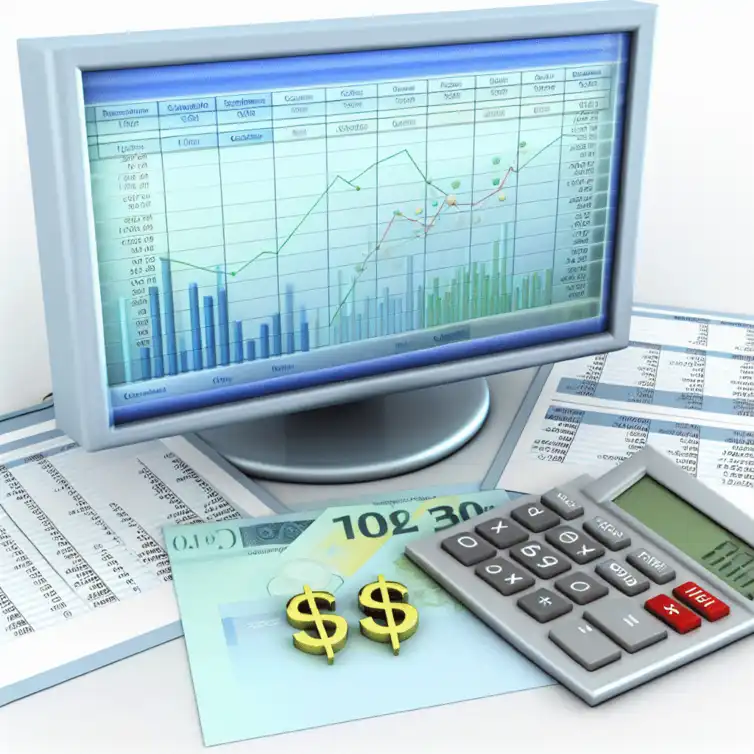
SUM
Adds up all values in a specified range.
Use: Tracking total finances.

In a world where data drives decision-making, mastering tools like Google Sheets can be your game-changer. Embrace the power of financial analysis with the robust functions it offers and transform the way you manage your finances.
Google Sheets is a powerful tool that simplifies the way we conduct financial analysis. It offers a range of functions that can help individuals and businesses manage their finances better. With the growing reliance on data-driven decisions, understanding how to effectively use Google Sheets functions becomes crucial for analyzing financial information efficiently.
Using Google Sheets for financial analysis not only saves time but also helps in organizing data neatly. By leveraging various functions, users can quickly calculate key metrics, generate reports, and visualize their financial health. This flexibility makes Google Sheets a popular choice among finance professionals and small business owners alike!
One of the main reasons Google Sheets is favored for financial analysis is its collaborative nature. Multiple users can work on the same document simultaneously, making it easier to share insights and data. Additionally, Google Sheets is accessible from any device with an internet connection, which means you can access your financial data anytime, anywhere. For more insights on collaborative features, check out our guide on collaborating in Google Sheets.
Moreover, Google Sheets integrates seamlessly with other Google services and apps, allowing for easy data import and export. This connectivity can enhance your analysis by pulling in relevant data from different sources. Here are some key benefits of using Google Sheets for financial analysis:
When starting with Google Sheets, it's essential to get familiar with some basic functions. These foundational functions are the building blocks for more complex financial analysis. The most commonly used functions include SUM, AVERAGE, and COUNTIF, each serving a specific purpose in data calculation. Utilizing these functions can provide key insights for budget tracking; consider our budget tracking tips for further assistance.
Understanding how to navigate these functions can greatly improve your financial reporting. By mastering them, you can create formulas that summarize your data quickly and accurately. Let's look at these key functions in more detail:
The SUM function is particularly useful when you want to calculate total expenses or revenue over a period. For instance, if you have a list of monthly expenses, you can easily find the total using this function. This allows you to see where your money is going!
The AVERAGE function helps you assess performance trends. By averaging revenue over several months, you can identify patterns and make informed decisions about budgeting or spending. Lastly, the COUNTIF function is essential for analyzing data sets based on specific conditions, such as counting how many sales exceeded a certain value.
This visual representation highlights the core functions of Google Sheets crucial for financial analysis, showcasing their purposes and applications.
Adds up all values in a specified range.
Use: Tracking total finances.
Calculates the mean of a set of values.
Use: Assessing performance trends.
Counts the number of cells that meet a specific criterion.
Use: Targeted data analysis.
Fetches live data from the stock market.
Use: Real-time financial tracking.
To enhance your financial analysis in Google Sheets, consider using named ranges. By assigning a name to a specific range of cells, you can simplify your formulas and make them easier to understand. For example, instead of using a cell range like A1:A10, you could use a named range like "MonthlyExpenses." This not only improves readability but also reduces the chances of errors in your calculations!
In the world of financial analysis, mastering Google Sheets functions can make a huge difference! By using powerful tools like SUM, AVERAGE, and the GOOGLEFINANCE function, you can efficiently analyze data and make informed decisions. This section will recap some essential functions and encourage you to explore deeper techniques that can enhance your analysis.
To effectively leverage Google Sheets for your financial analysis, remember the core functionalities:
As we wrap up, let’s focus on the key functions that drive financial analysis in Google Sheets. Understanding these functions will help you manage and interpret financial data effectively!
Here are some functions to remember:
Financial analysis is a vast field, and while Google Sheets provides essential tools, there’s always more to explore! I encourage you to dive into advanced techniques that can elevate your analysis.
Consider exploring:
By embracing continuous learning, you’ll become more adept at using these powerful functions and techniques!
Engaging with a community of fellow users can really enrich your experience with Google Sheets! Sharing insights and experiences can provide fresh perspectives and new ideas for your financial analysis.
I invite you to share your journey with Google Sheets. Here’s how you can get involved:
In addition to community engagement, there are plenty of resources available to deepen your understanding of financial analysis techniques. Make use of these tools to sharpen your skills!
Some great resources include:
Utilizing these resources can enhance your knowledge and provide you with the confidence to tackle complex financial data.
Here is a quick recap of the important points discussed in the article:
Dynamic Dropdown Lists in Google Sheets

Have you ever found yourself overwhelmed by the amount of data you need to manage? Dynamic dropdown
Minimalist Calendar Template in Sheets

Have you ever felt overwhelmed by cluttered calendars that make it hard to focus on what really matt
Competitive Analysis with Google Sheets

In a competitive landscape, the key to thriving lies in understanding your rivals. The insights you


Integrating Google Sheets with Tools
Automating Tasks in Google Sheets
Simple Google Sheets Goal Tracker
Getting Started with Array Functions
Track Your Networking Follow-Ups